United Stated Department of Agriculture
FOREST SERVICE
(Annual Planting Report) July 1, 1937
Regional Forester, All Regions
Dear Sir:
I am enclosing copies of a set of nine charts dealing with the planting activity, based upon the statistical summaries in the 1936 Regional planting reports. These charts will be of interest to all personnel engaged in planting or nursery work, and sufficient copies are enclosed so that one may be supplied to each nursery and each planting forest.
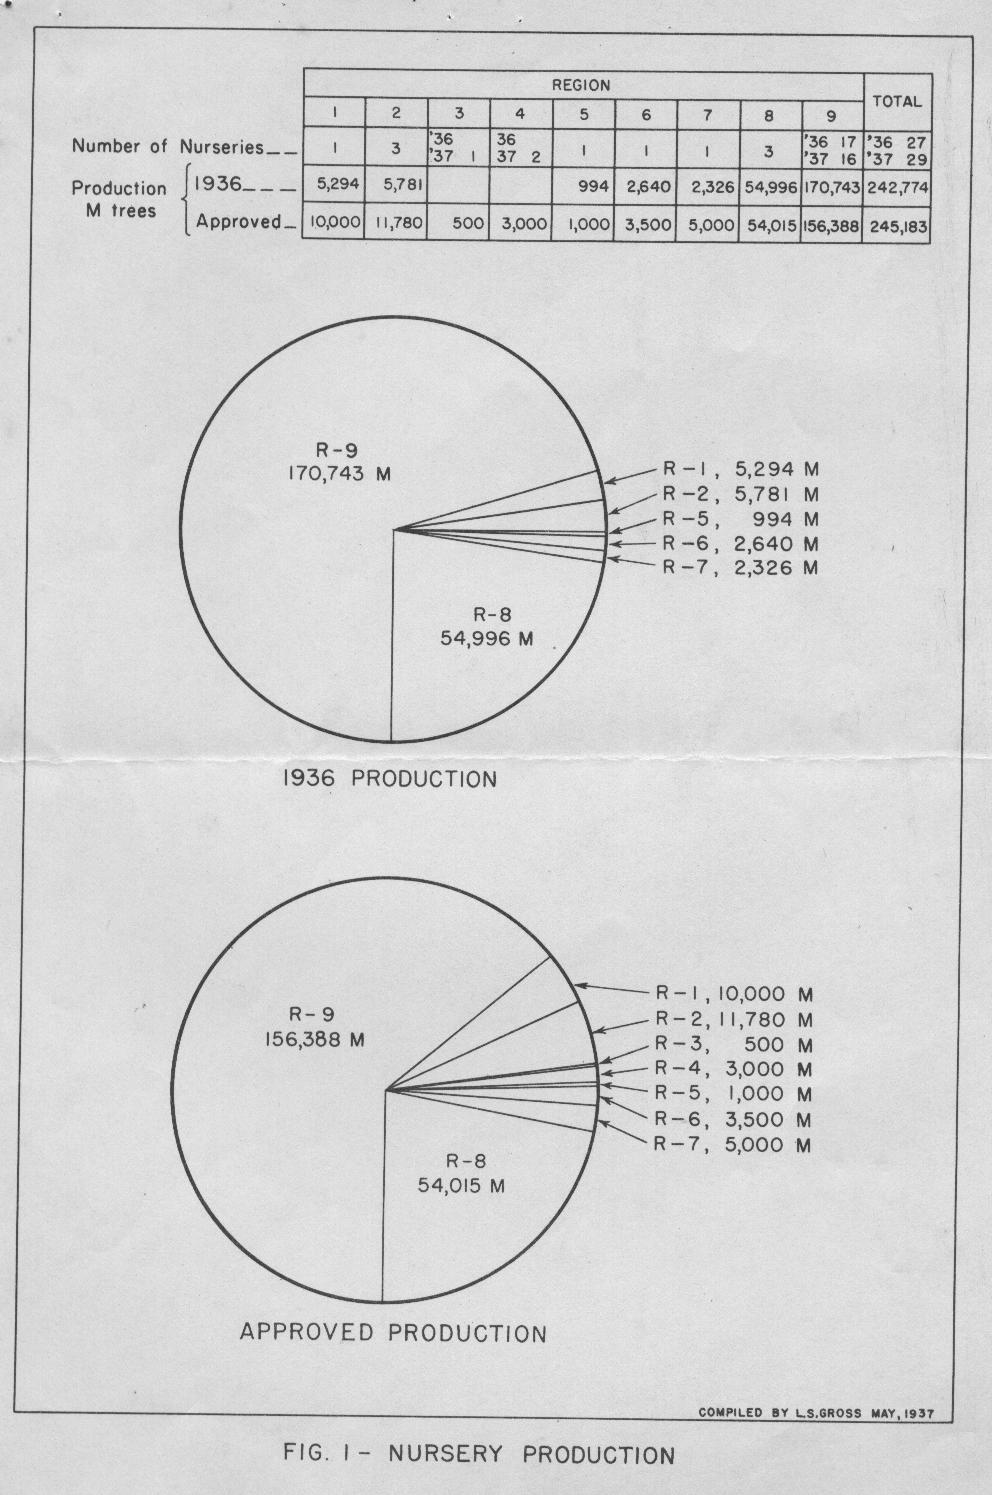
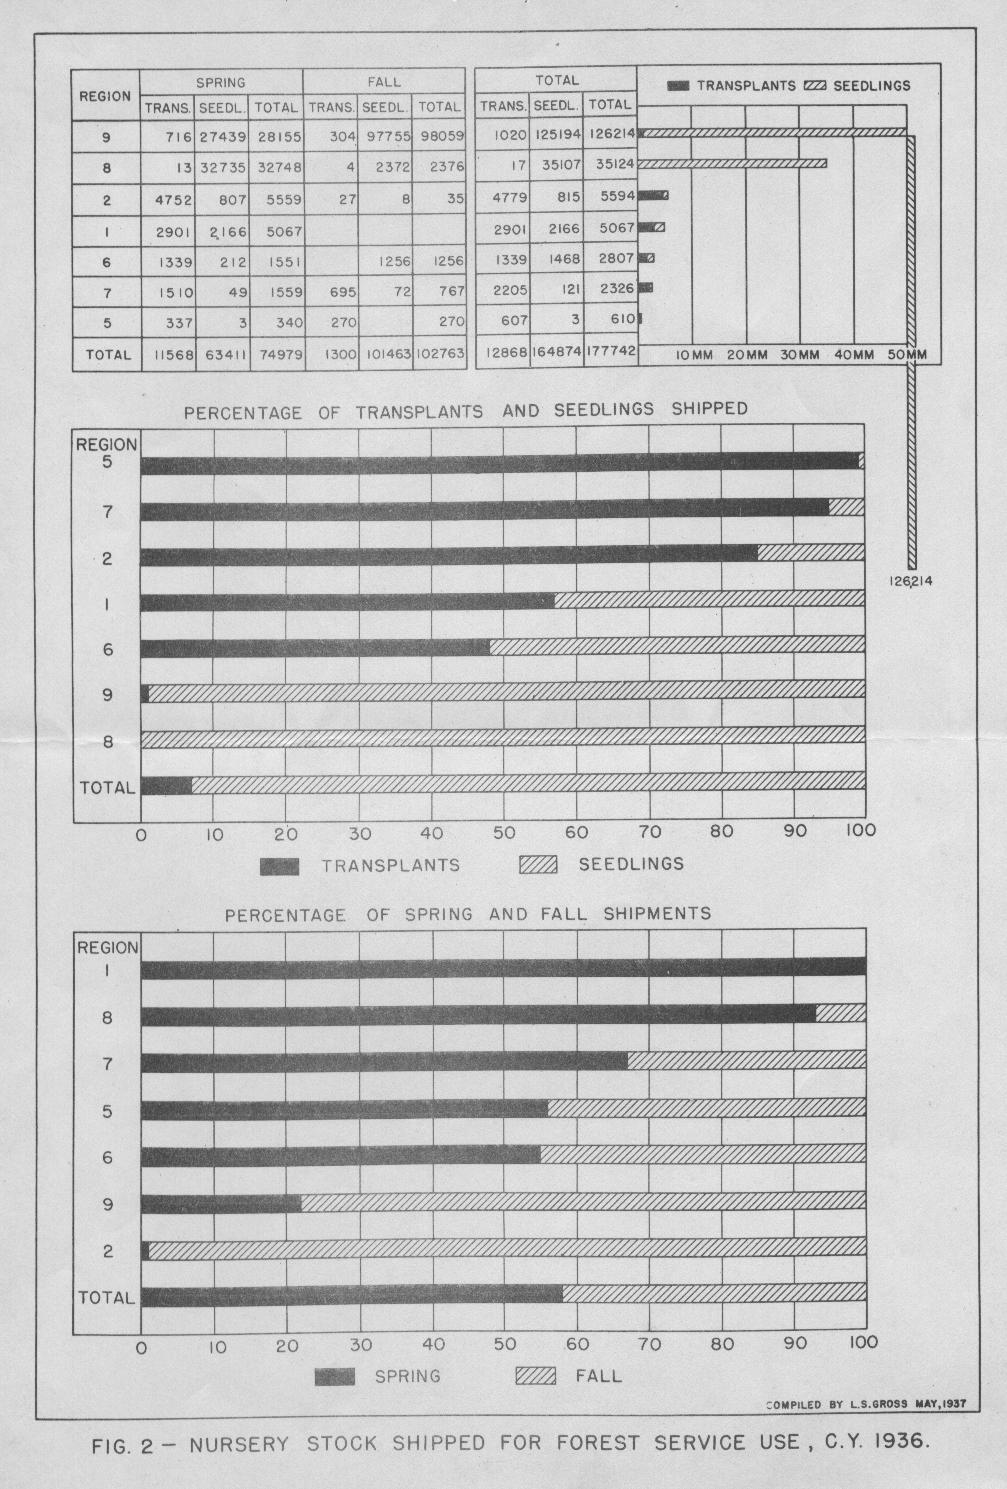
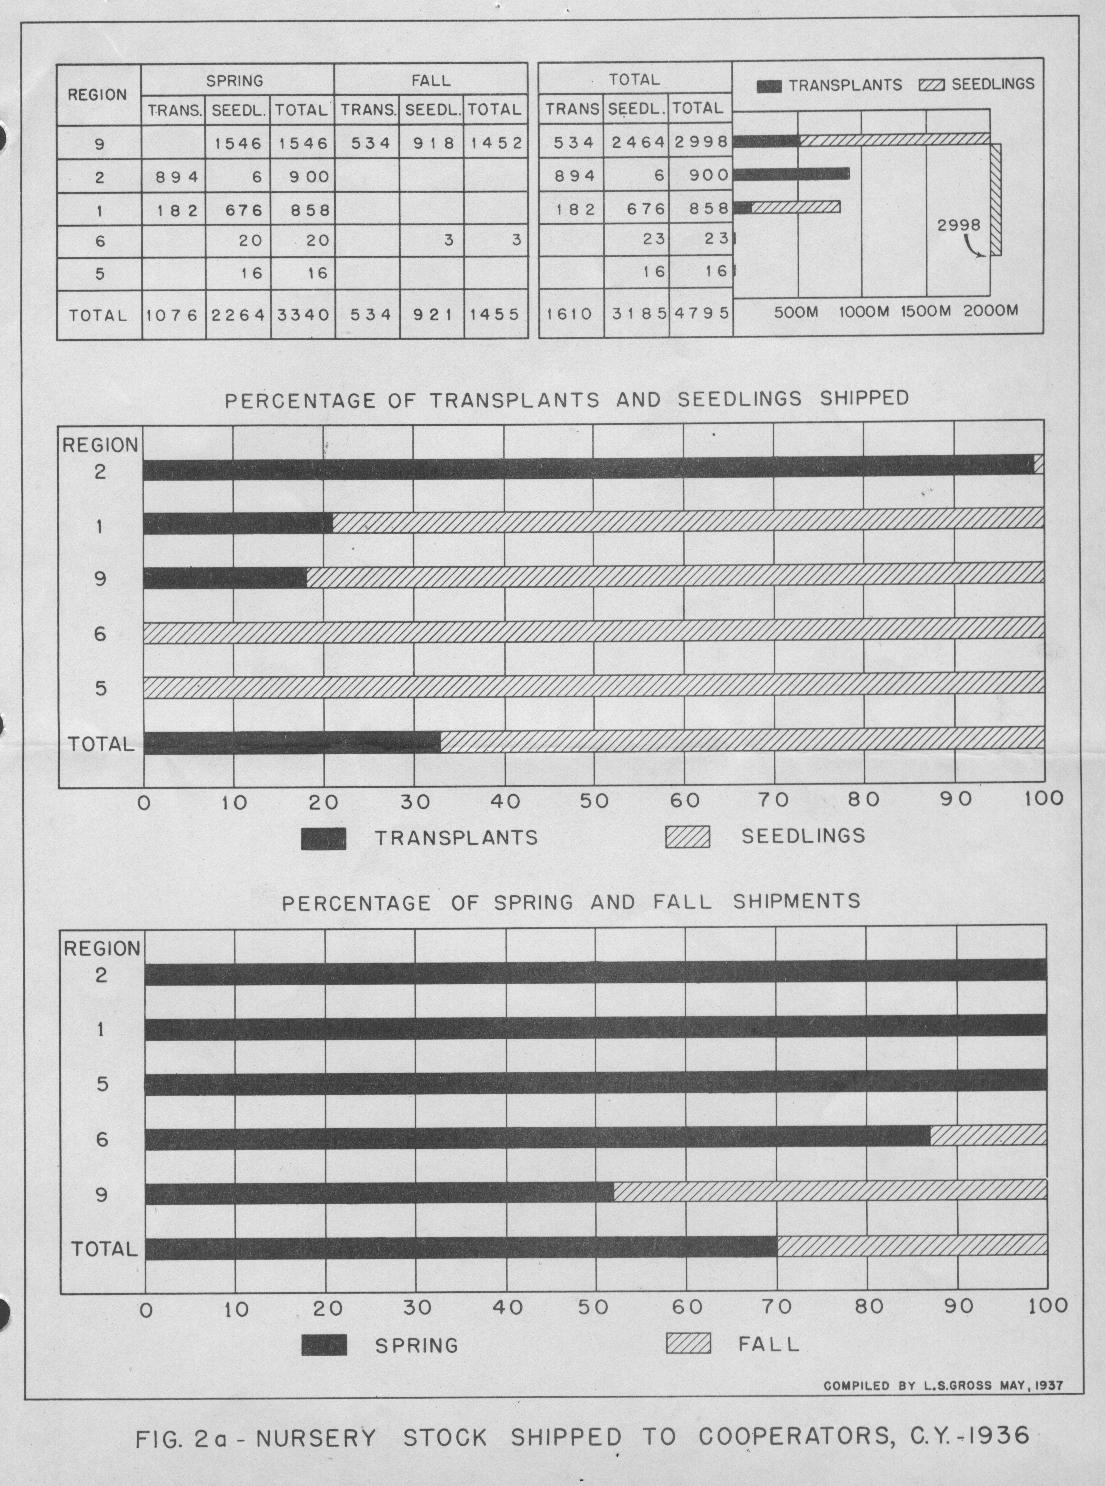
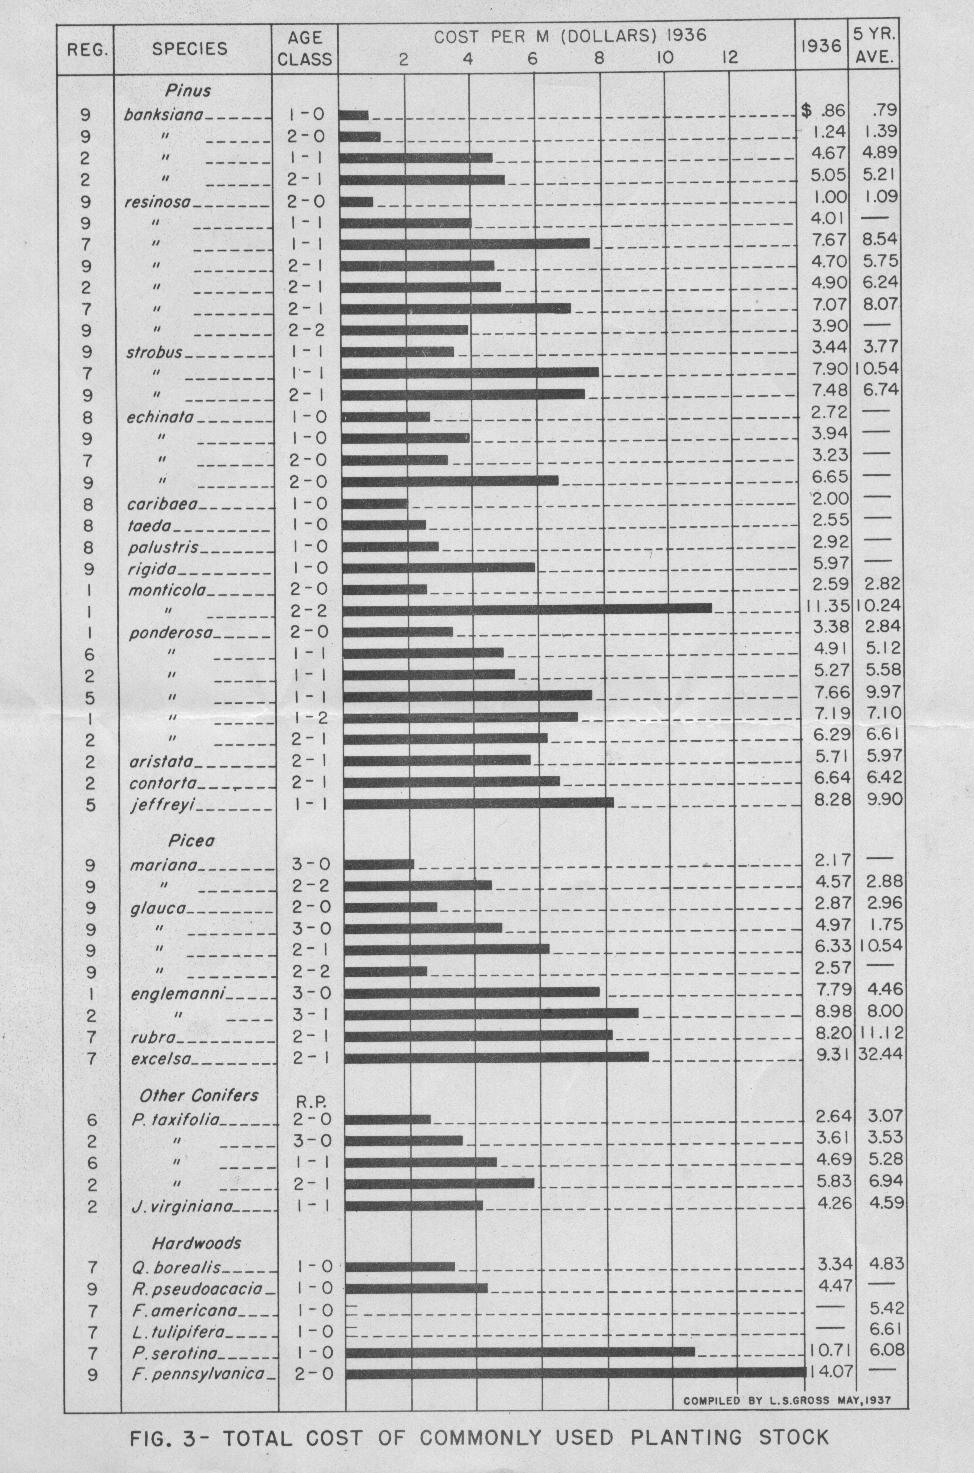
I think that you will find each chart to be self-explanatory. Figures 1, 2, and 2a require no comment. Figure 3 is of interest in that it indicates the wide variety of species and age classes of planting stock commonly produced in our nurseries. Valuable comparisons may be made regarding the cost of producing stock of the same age class and species in different Regions. For example, 1-1 Pinus ponderosa cost per M in 1936: in R-6, $4.91; in R-2, $5.27; in R-5, $7.66. Cost of 2-1 Pinus resinosa, in 1936, was: in R-9, $4.70; in R-2, $4.90; in R-7, $7.07. The lowest cost stock produced in 1936 was 1-0 Pinus banksiana, in R-9; the same Region reported the most expensive stock, 2-0 Fraxinus pennsylvanica, at $14.07 per M. In general, pine stock is produced more cheaply than other species, spruce stock is more expensive, and hardwood species show high costs, considering the fact that they are practically all shipped as 1-0.
Planting stock cost per M for any given species and age class may vary between Regions and nurseries, due to cost of seed, annual production at the nursery, total undepreciated nursery investment, losses from insects, diseases and other causes. Costs are also greatly affected by the character and wage rate of available labor, and by the experience and skill of the nurserymen. Both the current and five-year average costs will be watched with great interest, but none of us must forget that the nursery is only the halfway station between seed on the trees and successful plantations. Quality of planting stock cannot readily be shown in a graphical presentation such as Figure 3, although it undoubtedly enters the pictures shown in Figure 8. No nurseryman can be satisfied with his costs until he is dead sure that "poor stock" is responsible for the minimum plantation loss consistent with reasonable production cost.
It has been impossible to present seed collection and extraction data because of lack of complete information from several Regions. The data show, however, that more than 35,000 bushels of cones and 37,000 pounds of hardwood fruits were collected, Region 8 leading in coniferous collection and Region 9 in hardwood.
There is no chart numbered 4.
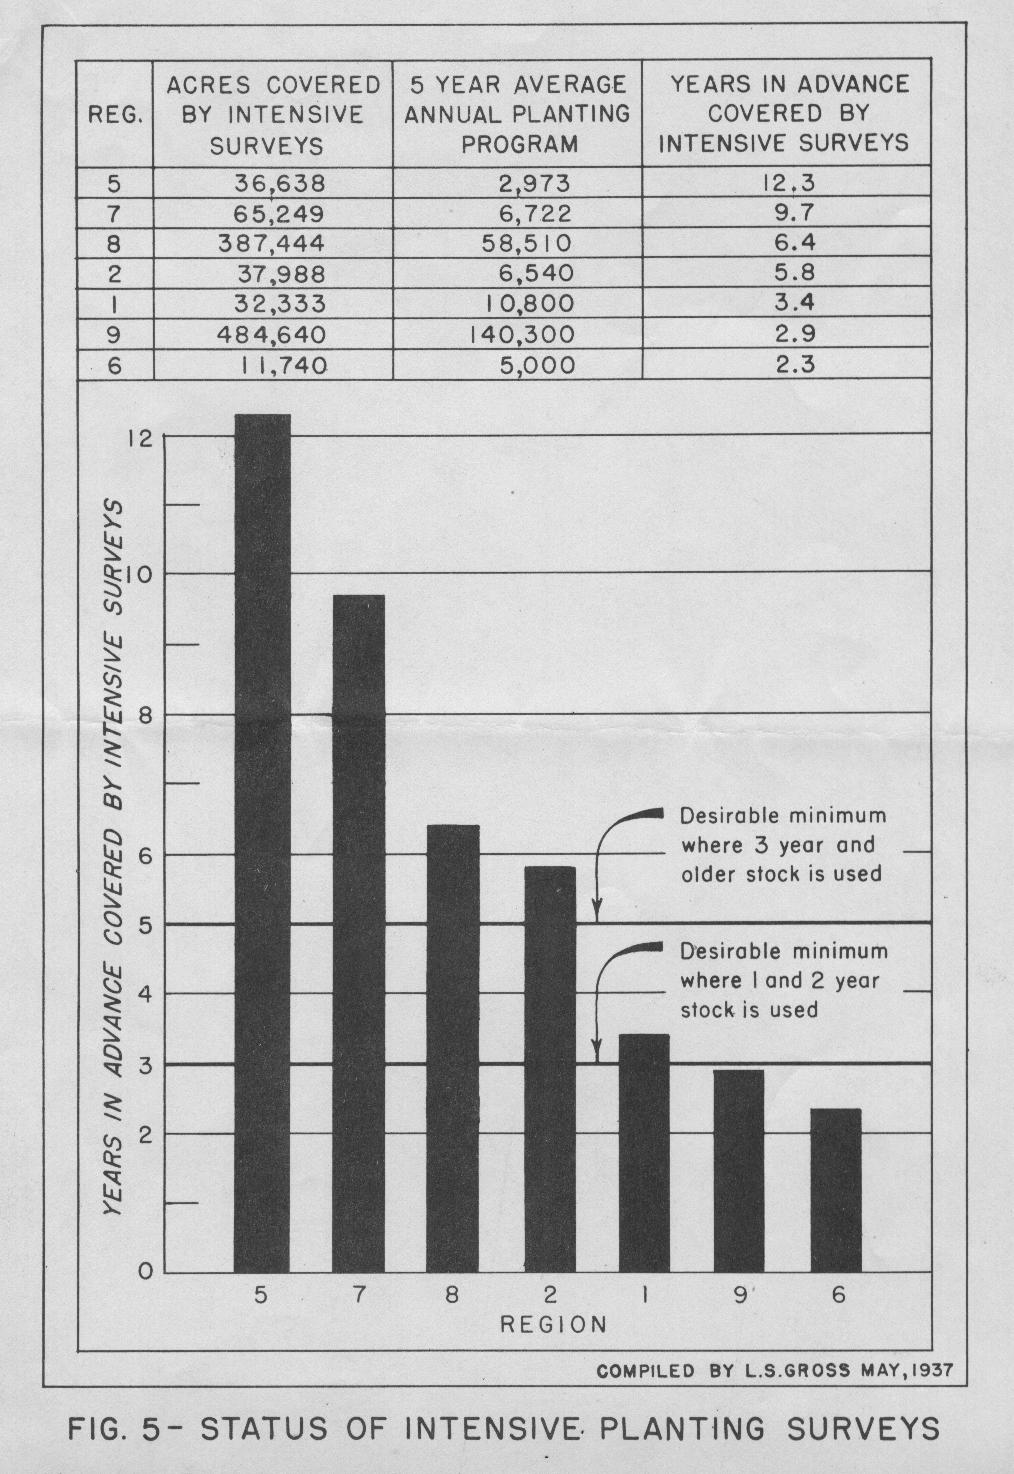
Figure 5 is worth a bit of study. Our planting program can be handled intelligently only to the extent that we know what we are doing, not only this year, but at least three of five years in the future. Planting surveys must be kept that far in advance of planting since seed from the proper sources must be sown for the production of planting stock for specific areas. Not all of the Regions show satisfactory margins of areas surveyed intensively, when compared to the average annual planned planting program.
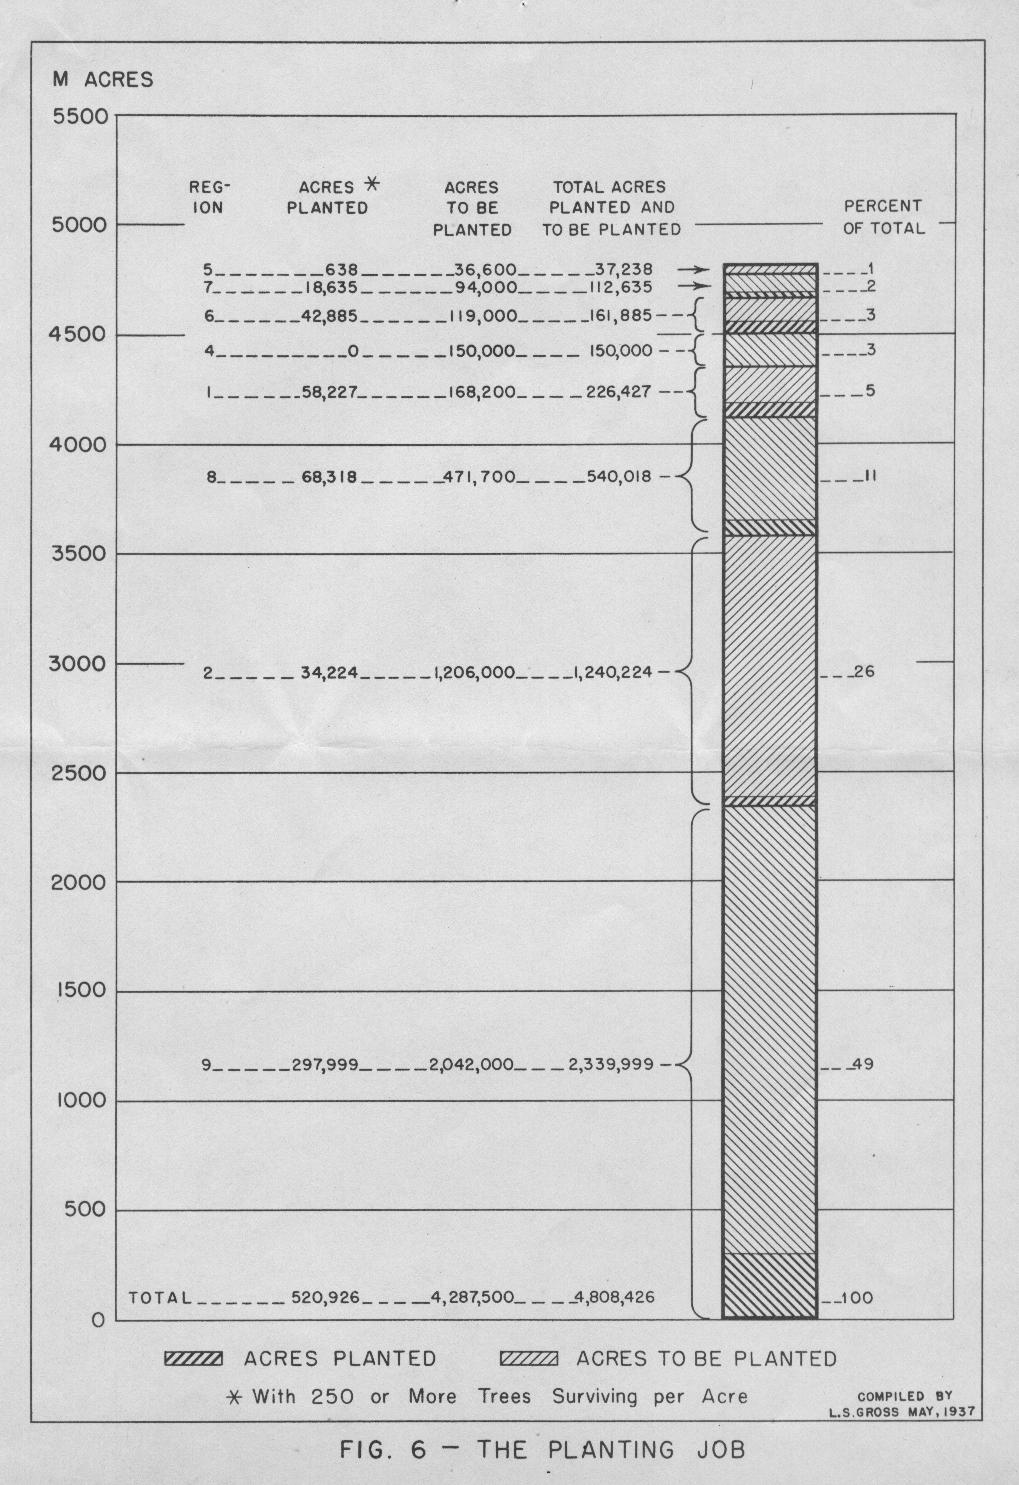
Figure 6 is undoubtedly the least accurate presentation in the entire group. It is of great importance that we have a sound conception of the size of the National Forest planting job. Letters from this office have stressed the need for action in this regard and it is hoped that the 1937 Annual Reports will contain more accurate estimates of and needing planting.
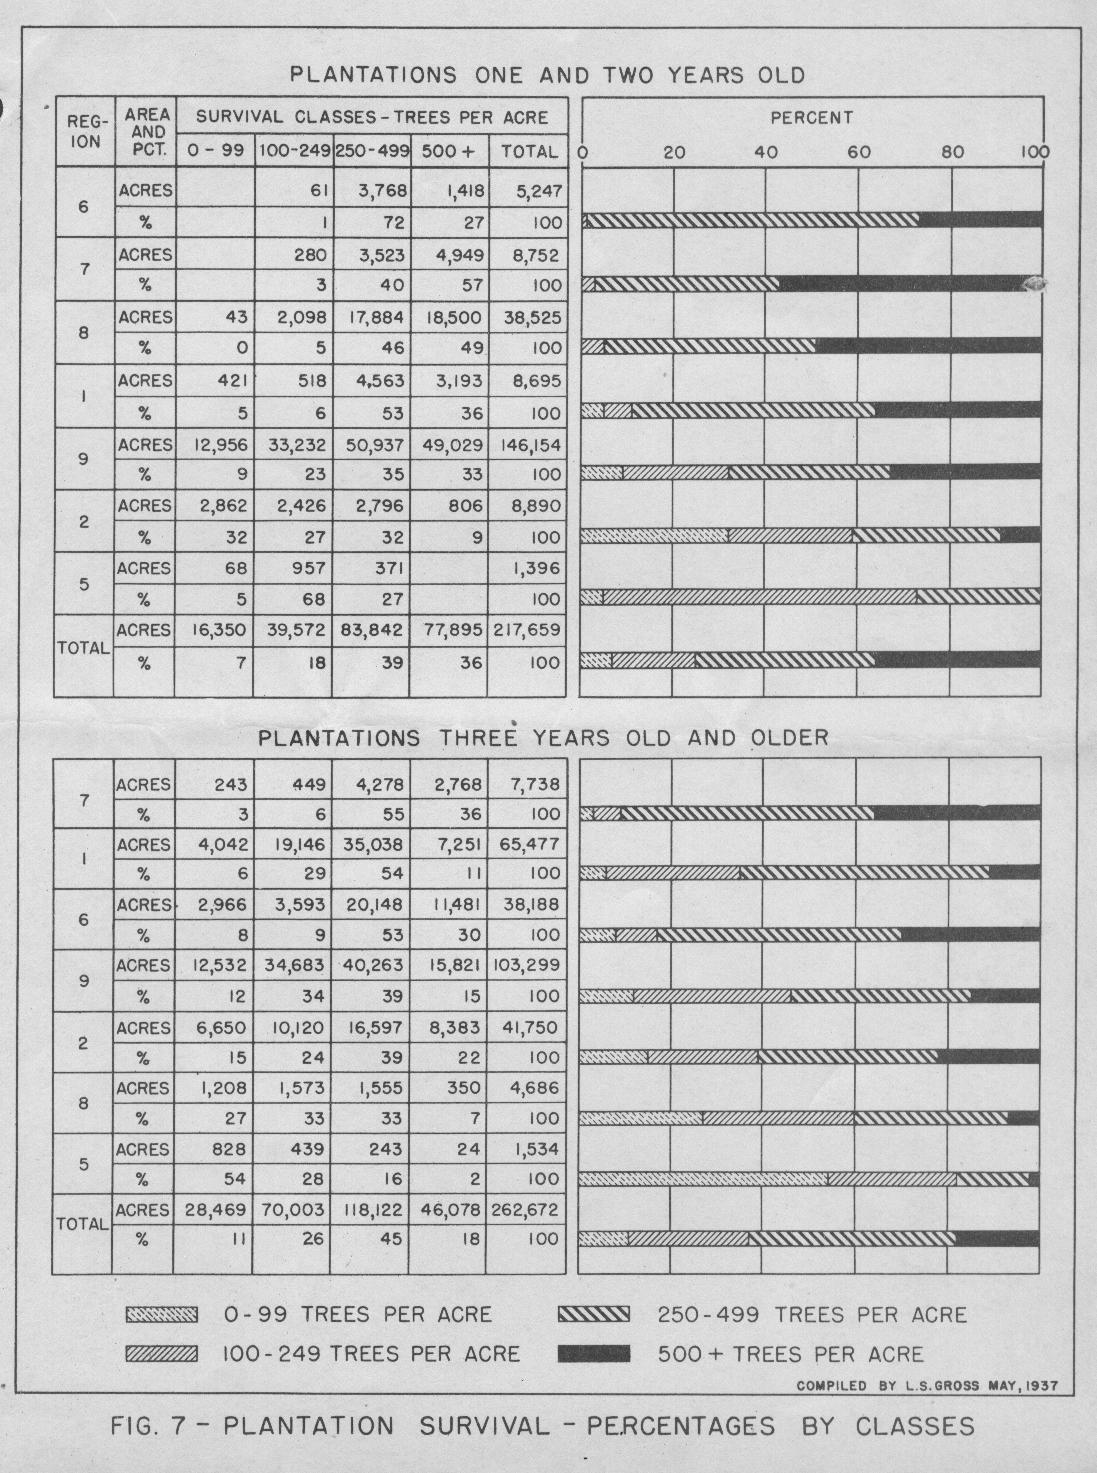
Figures 7 and 8 should be studied together. They represent the best available information on the results of the National Forest program of reclamation of wrecked land. The picture is not all bright and sunny, aside from doubts as to the accuracy of some of the data. It has its somber side. We have adopted a minimum of 250 tress per acre as representing satisfactory survival. This is an arbitrary figure, representing only one of several factors which must be considered in the definition of a satisfactory stand of any species at any age. Species, distribution and dominance are highly important, as is the presence of established natural reproduction of desirable species. A stated number of surviving trees per acre is, however, the simplest measure of success, and, at least until some other criterion has been developed, we will continue to recognize 250 trees per acre as the minimum satisfactory stand. Special cases for which higher or lower standards are necessary will always exist. Footnotes may be appropriately used in Regional reports to call attention to such cases.
The important thought in Figure 7 is not that we have better than 164 thousand acres of plantations three years of age and older which show 250 or more trees per acre, and 161 thousand acres of one and two-year-old plantations in this class, but that more than 1/3 (37%) of our older and exactly ¼ (25%) of our younger planted acres show less than a satisfactory stand. Judged from these data, our planting efforts are only about two-thirds successful. There are many reasons, and perhaps some alibis, for this unsatisfactory condition. Suffice it to say that improvement is imperative, and that it can be accomplished only by careful application of present knowledge to our problems, and by painstaking study and improvement of our technique.
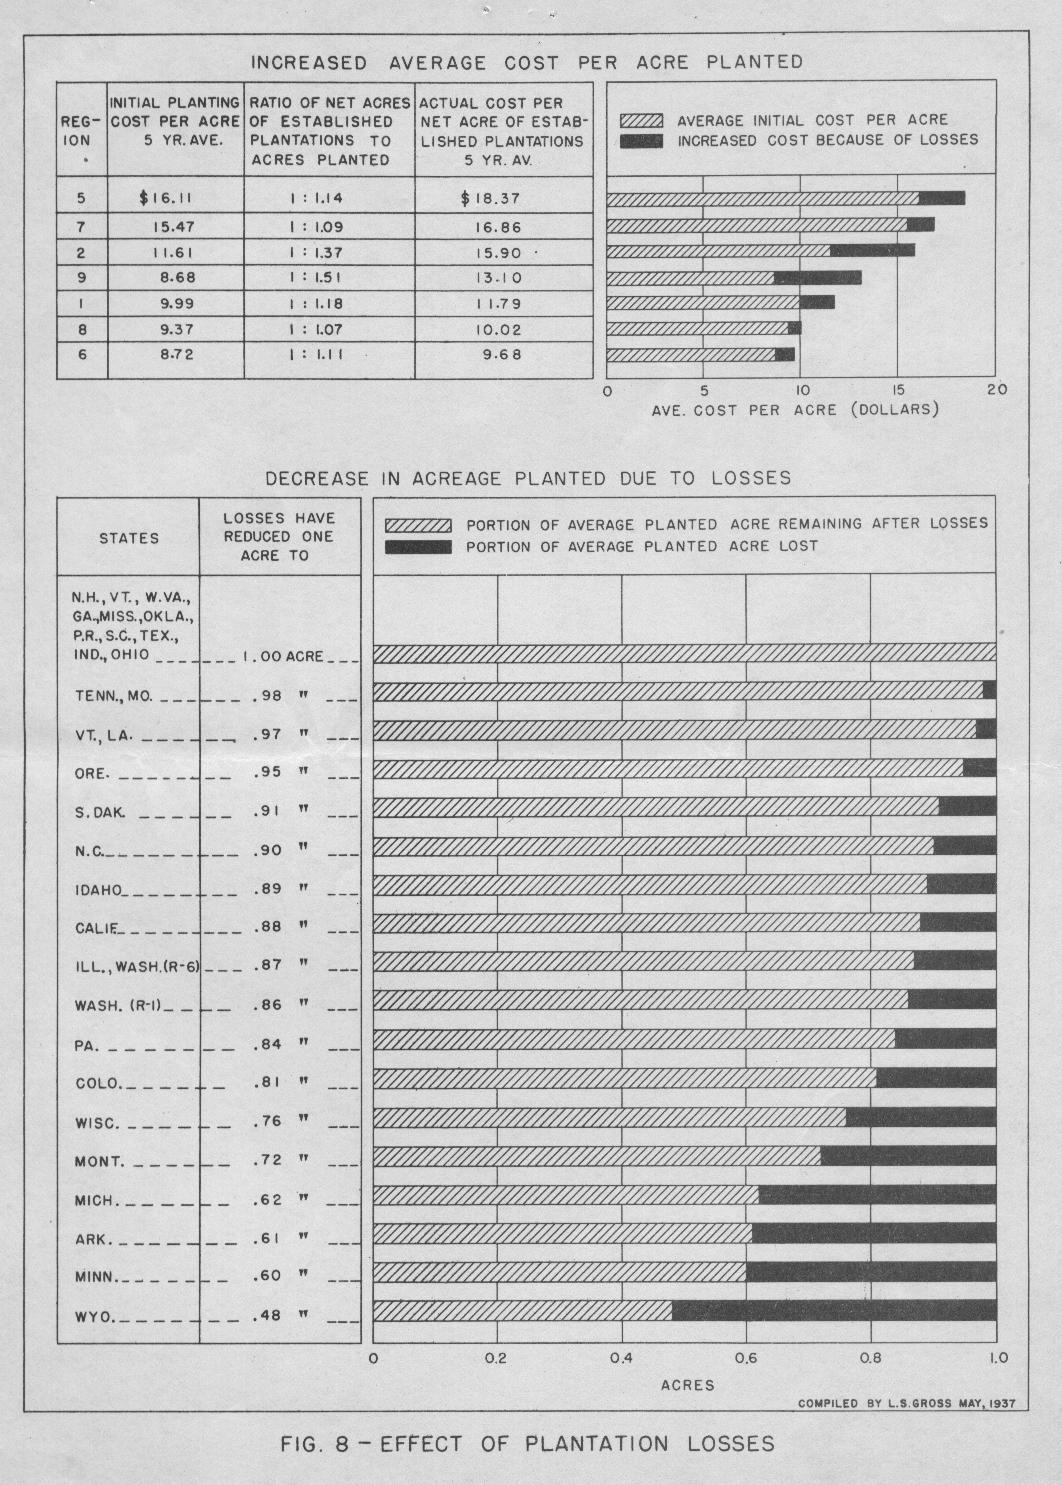
In Figure 8, the data are interpreted in two ways. 8A shows the added per-acre cost caused by plantation losses and 8B shows, by states, shrinkage in planted acreage caused by the same losses. There is at least one major defect in the data upon which these graphs are based. Not all Regions define a "lost" or "dropped" plantation in the same way. Examinations of failed plantations may be discontinued, but they are never dropped from the investment records, and the true measure of the success of our planting effort must include all areas of planted and all expenses incurred. Figure 8B points very definitely to those states in which improved plantation protection and increased survival are essential if the Service planting program is to be as successful as the public has a right to expect it to be.
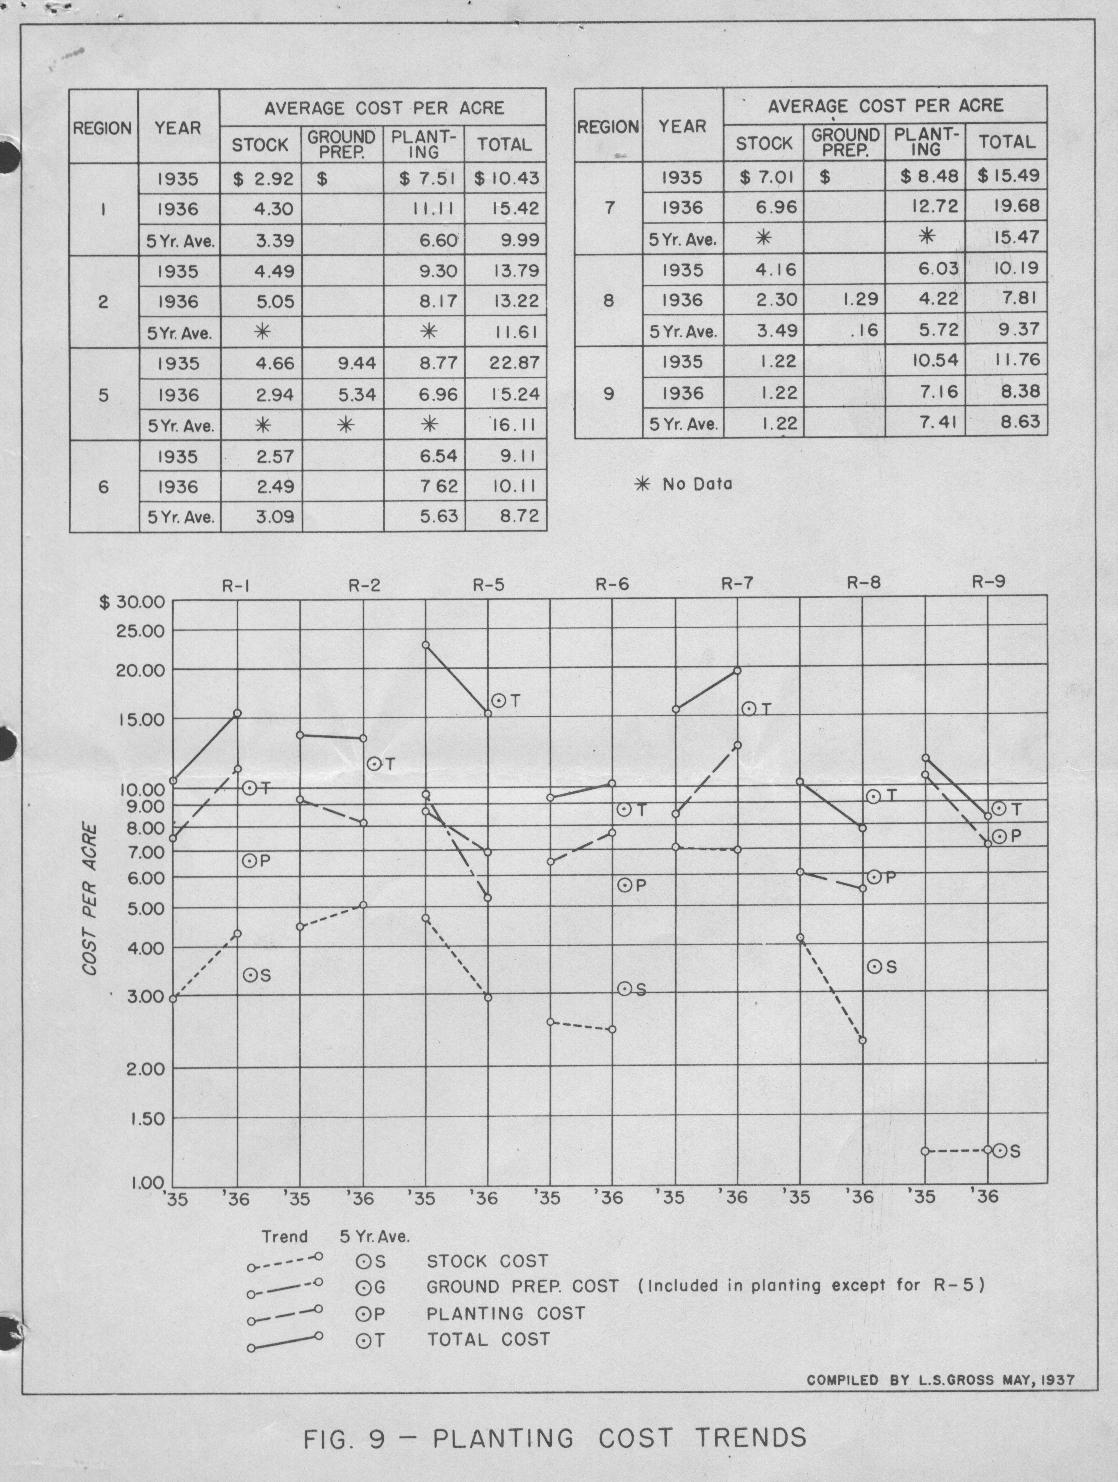
Initial cost of plantation establishment is always important. Many factors influence costs, but conditions vary so greatly between Regions that comparisons are not particularly sound nor indicative of relative efficiency. After considerable thought, Figure 9 was drawn on semilogarithmic paper in order to afford a direct comparison of planting costs between Regions for the years 1935 and 1936. Five-year average costs, where available, are also shown. One important consideration to be borne in mind is study of Figure 9 is that the rate of change from 1935 to 1936 is shown by the angle of the line connecting the two points. Lines of equal steepness indicate the same rate of increase or decrease in cost. In general, rising costs are undesirable, but they may represent the use of older, more costly, but more suitable planting stock. Higher costs may also indicate greater care in planting, which may result in increased survival and more satisfactory final cost of successful plantations of they may result from inadequate or inefficient supervision, which will ordinarily have the opposite result. Interpretation of those cost data must necessarily be left to each Region and I am sure that you will give careful consideration to the factors which influence your costs. You must diagnose the case, write the prescription, treat the patient, and effect the cure.
You will observe that not all the data presented in the statistical summary have been presented in this series of graphs. Those selected were considered to be the most important. I hope that all men will find the presentations as helpful and interesting as do the members of this office. It is our plan to prepare and distribute similar compilations each year. Your suggestions as to their value and any proposals as to changes will be welcome.
Very truly yours,
E. E. CARTER
Chief, Division of Timber Management